Bollinger Band + cash-secured put (BB + CSP)
Search focus: bollinger band cash secured put · sell puts bollinger bands · bollinger lower band put selling · CSP entry timing strategy
A cash-secured put pays you a premium for agreeing to buy 100 shares at the strike — but when you sell matters. This lesson adds a rules-based timer: sell the CSP when the daily price touches the lower Bollinger Band.
The logic is simple. A lower-band touch means price sits about two standard deviations below its 20-day average — statistically stretched. Selloffs like that usually arrive with elevated implied volatility (IV), and high IV means richer put premiums. You sell expensive insurance after a dip, with a strike set well below, and let time decay do the work.
Bollinger Bands in 30 seconds
- Middle line: the 20-day simple moving average of price
- Upper / lower bands: the middle ± 2 standard deviations
- Lower-band touch: price roughly 2σ below its average — short-term oversold relative to its own recent history
Honest framing first: bands describe where price has been, not where it is going. A touch is a disciplined entry trigger, not a prediction. The edge in this strategy comes from the CSP mechanics — elevated IV, far out-of-the-money strikes, daily theta decay — and the bands simply keep your timing consistent instead of emotional.
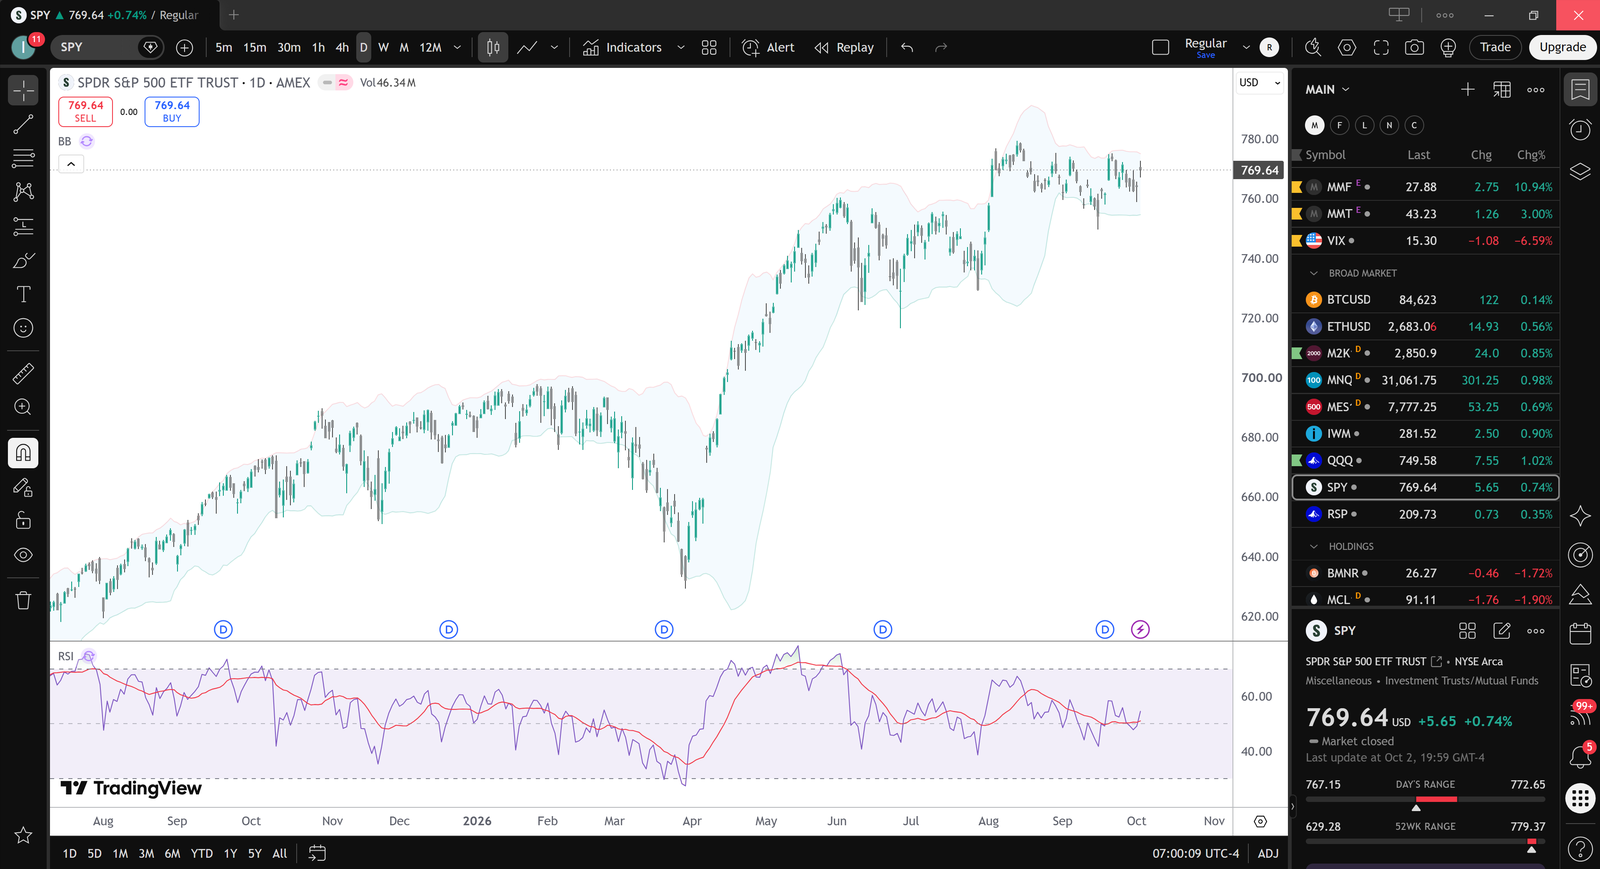
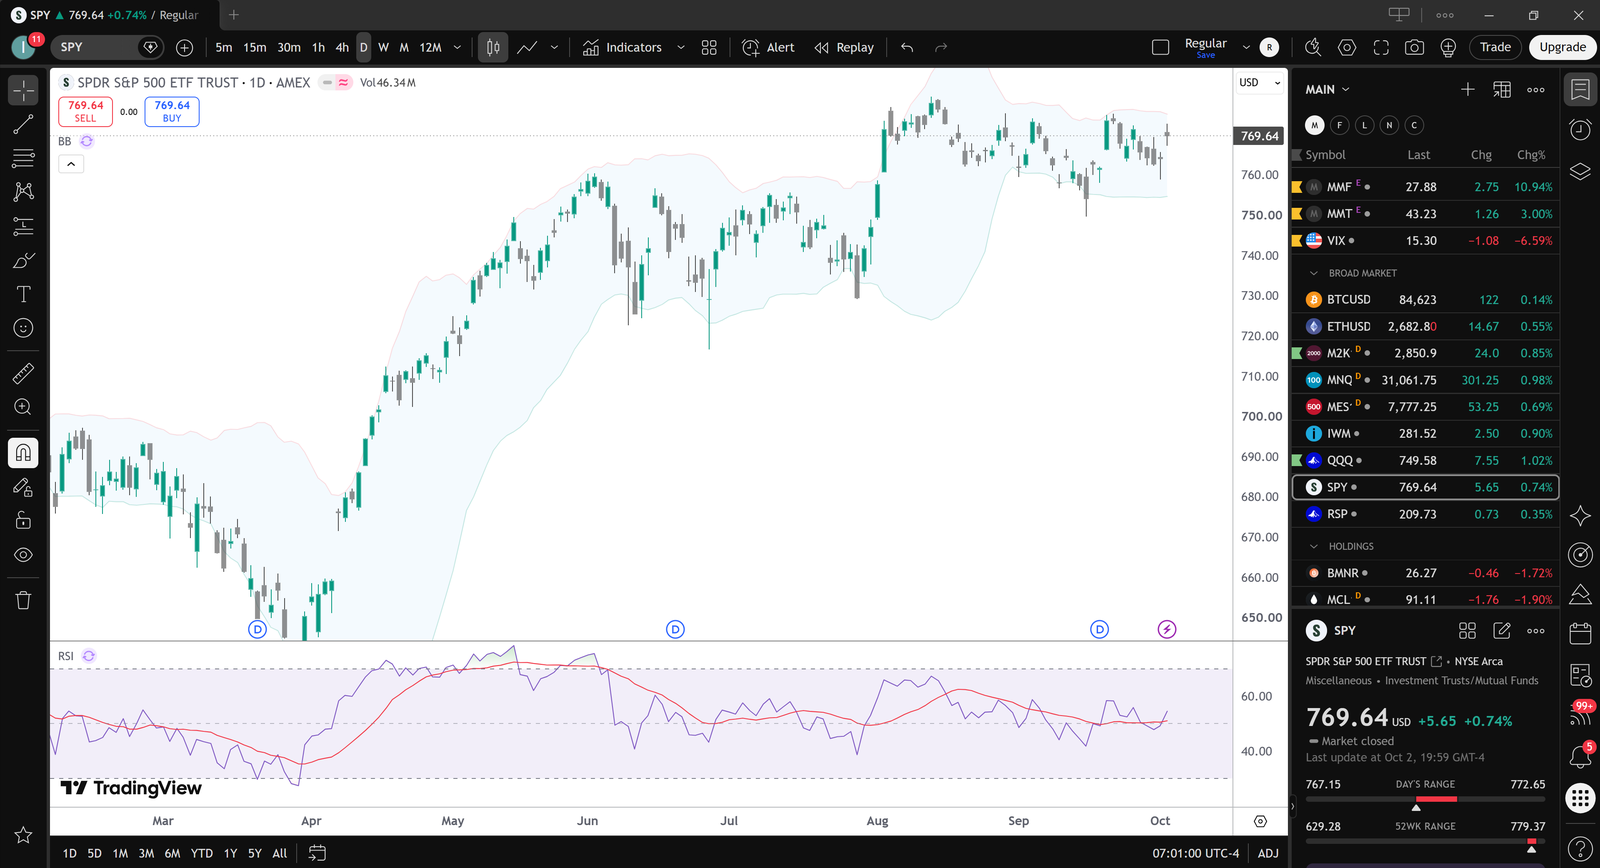
Price dips to the lower band (entry trigger), then mean-reverts — the move the put seller gets paid to wait for
The rules
1. Market regime: neutral or bullish only
This strategy does not fight downtrends. Skip the trade when the weekly or daily trend is clearly down — price under a falling 50-day moving average, or a pattern of lower highs and lower lows. In a real downtrend, price can ride the lower band for weeks: every touch is a falling knife, not a bargain.
2. Entry: daily touch of the lower band
When the daily candle touches or closes below the lower Bollinger Band (20, 2), that is your signal to evaluate a CSP — not before. No touch, no trade.
3. The put: 45+ DTE, about 10% below spot
- Expiry: 45 days or more — the theta-decay sweet spot: enough premium to matter, enough time for price to stabilize
- Strike: roughly 10% below the current spot — or about 10 delta, whichever fits the ticker better. On very volatile names 10% can still be near the money, so let delta be the tiebreaker.
- Only sell on underlyings you would be happy to own at the strike — the golden rule of CSPs applies double here.
4. Exits — whichever comes first
- 50% of max profit: close once you have kept half the premium. This locks in most of the gain and frees your cash for the next setup.
- 21 DTE: close with three weeks left, no matter what. Gamma risk accelerates inside ~21 days — this rule sidesteps expiry-week drama.
- Upper-band touch: if price rallies to the upper Bollinger Band, the mean-reversion move you were paid to wait for has happened — take the win.
XYZ recovers to $104 in three weeks and the put decays to $0.70 → close near 50% profit.
Or XYZ tags the upper band → close.
Or 21 DTE arrives → close whatever value is left.
If XYZ keeps falling through $90 and you are assigned: you own 100 shares at $90, effective cost ≈ $88.50. That was the risk you accepted on entry.
What it looks like on a real chart
The charts below show the setup's shape on SPY — they illustrate the pattern, they don't predict future results.
Why these numbers work
- 45 DTE: theta decay is strong, yet there is time for the snap-back
- 21 DTE: gamma — the risk of violent price moves near expiry — rises sharply, so the rule exits before it
- 50%: most CSPs reach half-profit well before expiry; waiting for the last dollar ties up capital
- Upper band: a symmetric exit — you entered on stretched weakness, you leave on stretched strength
Where the edge really comes from
Be clear-eyed: the Bollinger touch itself predicts nothing — band touches have weak standalone forecasting power. The returns here come from three structural facts: (1) you sell when IV is elevated, (2) far out-of-the-money puts expire worthless most of the time, (3) every passing day melts the put's time value in your favor. The bands are the discipline layer — a repeatable trigger that stops you from selling puts at random emotional moments.
Pairs with the Wheel
Assignment isn't a failure of this strategy — it's the Wheel's first step. If the put is assigned, you own 100 shares at the strike (minus the premium you kept). The Wheel continues from there: sell covered calls against the shares until they are called away, then restart the cycle with a fresh Bollinger-timed CSP.
Try it in the Builder
Open Cash-Secured Put in Builder → CSP basics Advanced lessons
Model it: short put, about 45 DTE, strike ~10% below spot. Check max profit, break-even and probability of profit — then move the strike closer and watch how the numbers change.
Beginner FAQ
Why 45 DTE instead of 30?
45 DTE holds more premium and gives the mean-reversion room to play out. 30 DTE decays faster but pays less and forgives less if the recovery is slow.
What if the stock keeps falling after I sell?
Then assignment is the outcome: you buy 100 shares at the strike. This is why the regime filter and the "happy to own it" rule are non-negotiable.
Can I use this on any stock?
It works best on liquid underlyings with tight bid-ask spreads. On very volatile names, 10% below spot can still be close to the money — use about 10 delta instead of a fixed 10%.
Does the upper-band exit leave money on the table?
Sometimes, when momentum continues after the touch. The rule deliberately trades the last dollars for consistency.
Next: Compare with the plain cash-secured put, then test both in the Strategy Builder.
Bollinger + CSP quiz
Timing put sales with band touches — and knowing when to skip.